Pages

Saturday, June 7, 2014

time shifting and scaling of signal


% time shifting and scaling of signal
clc;
clear all;
close all;

limit=15;
step=0.01;
T=5;
t=-limit:step:limit;
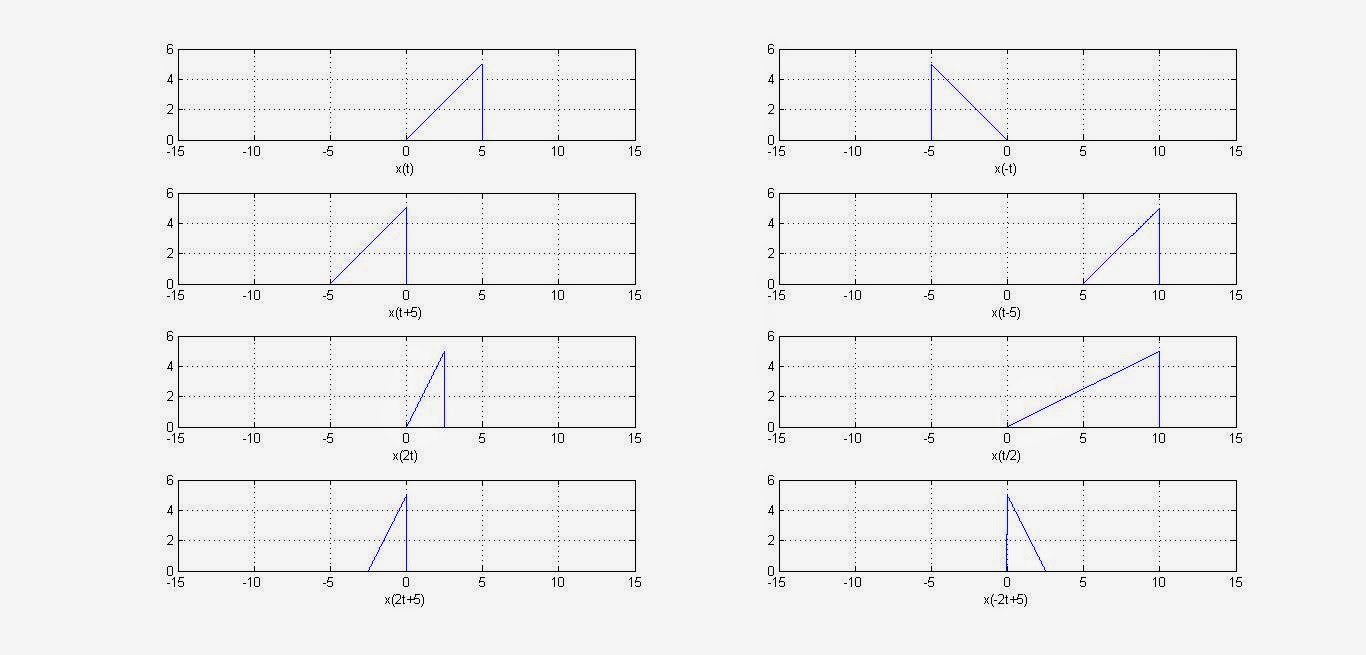
 x=t.*[t>=0 & t<=T];
 subplot(421)
 plot (t,x);
 grid on;
 xlabel('x(t)');

 a=-1;
 t0=0;
 t1=a*t+t0;
 x=t1.*[t1>=0 & t1<=T];
 subplot(422)
 plot (t,x);
 grid on;
 xlabel('x(-t)');

 a=1;
 t0=5;
 t1=a*t+t0;
 x=t1.*[t1>=0 & t1<=T];
 subplot(423)
 plot (t,x);
 grid on;
 xlabel('x(t+5)');

 a=1;
 t0=-5;
 t1=a*t+t0;
 x=t1.*[t1>=0 & t1<=T];
 subplot(424)
 plot (t,x);
 grid on;
 xlabel('x(t-5)');

 a=2;
 t0=0;
 t1=a*t+t0;
 x=t1.*[t1>=0 & t1<=T];
 subplot(425)
 plot (t,x);
 grid on;
 xlabel('x(2t)');

 a=1/2;
 t0=0;
 t1=a*t+t0;
 x=t1.*[t1>=0 & t1<=T];
 subplot(426)
 plot (t,x);
 grid on;
 xlabel('x(t/2)');

 a=2;
 t0=5;
 t1=a*t+t0;
 x=t1.*[t1>=0 & t1<=T];
 subplot(427)
 plot (t,x);
 grid on;
 xlabel('x(2t+5)');

 a=-2;
 t0=5;
 t1=a*t+t0;
 x=t1.*[t1>=0 & t1<=T];
 subplot(428)
 plot (t,x);
 grid on;
 xlabel('x(-2t+5)');

Sunday, February 23, 2014

HDB3


%HBD3
clc;
clear all;
close all;
x=[1 1 0 0 0 0 0 0 0 0 1 1 0 0 0 0 0 1 0];
%x=[1 0 0 0 0 1 0  1 1 1 0 0 0 0 1 0 1];
%x=[0 0 0 0 0 1 1 1 0 0 0 0 1 0];
hdb3_code=x;
ami_code=x;
nx=size(x,2);
next_pulse=1;
sign=-1;
B=0;
V=1;
N=0;
i=1;
flag=0;
four_zero=0;
while i<nx+1
    if x(i)==1
        hdb3_code(i)=next_pulse;      
        next_pulse=next_pulse*-1;
        N=N+1;      
       
    else
        if i<nx-2
            if (x(i+1)==0 & x(i+2)==0 & x(i+3)==0 )                                                              
                        if(rem(N,2)~=0 | flag==0)
                            B=0;
                            V=next_pulse*-1;
                        else
                            B=next_pulse;
                            V=B;
                            next_pulse=next_pulse*-1;
                        end                      
                        hdb3_code(i)=B;
                        hdb3_code(i+3)=V;                      
                        N=0;
                        flag=1;
                        four_zero=1;
                       
             end
        end        
    end
    if four_zero==1
        i=i+4;
        four_zero=0;
    else
        i=i+1;
    end
end
x
hdb3_code


i=1;
while i<nx+1
    t = i:0.001:i+1-0.001;
    if x(i)==1
        unipolar_code=square(t*2*pi,100);
        bipolar_code=sign*square(t*2*pi,100);
        sign=sign*-1;
       
    else
        unipolar_code=0;              
        bipolar_code=0;
       
    end
    subplot(3,1,1);
    plot(t,unipolar_code);
    ylabel('unipolar code');
    hold on;
    grid on;
    axis([1 nx -2 2]);
   
    subplot(3,1,2);
    plot(t,bipolar_code);
    ylabel('bipolar code');
    hold on;
    grid on;
    axis([1 nx -2 2]);
   
    subplot(3,1,3);
    plot(t,hdb3_code(i)*square(t*2*pi,100));
    ylabel('HDB3 code');
    hold on;
    grid on;
    axis([0 nx+1 -2 2]);
    i=i+1;
end


Sunday, May 12, 2013

Fourier series of rectangular wave


%Fourier series of  rectangular wave
clc;
close all;
clear all;

j=1;
T=4;    %Time period of square wave
tau=1;  %2tau= On time of the square wave
w0=2*pi/T;
N=50;
j=1;
for k=-N:1:N
    if(k==0)
        c(j)=2*tau/T;   % fourier series coefficients of rectangular pulse
    else
        c(j)=2*sin(k*w0*tau)/(k*w0*T);
    end
   j=j+1;
end
k=-N:1:N;
subplot(2,1,1);
stem(k,c);      %plot fourier series coefficients
grid on;
xlabel('k');
ylabel('fourier series coefficient of rectangular pulse');

%%----------------------------------------------------
l=1;
time=10;
for t=-time:0.01:time
    sum=0;
    j=1;
    for k=-N:1:N
        sum=sum+c(j)*exp(i*k*w0*t); %synthesis equation
        j=j+1;
    end
    s(l)=sum;
    l=l+1;
end
t=-time:0.01:time
subplot(2,1,2);
plot(t,s);          % plot rectangular pulse
grid on;
xlabel('time');
ylabel('rectangular pulse');


Wednesday, April 24, 2013

QPSK modulation


%try cosine wave plot also
%a=.5;  
pi=3.14;
f=1;

x=[0 0 0 1 1 0 1 1 0 0 1 0  1 1 0 1];
nx=size(x,2);

i=1;
while i<nx+1
    t = i:0.001:i+2;
    if x(i)==0 && x(i+1)==0
        z=sin(2*pi*f*t-3*pi/4);
        dibit=0;
    elseif x(i)==0 && x(i+1)==1
        z=sin(2*pi*f*t-pi/4);
        dibit=1;
    elseif x(i)==1 && x(i+1)==0
        z=sin(2*pi*f*t+pi/4);
        dibit=2;
    else
        z=sin(2*pi*f*t+3*pi/4);
        dibit=3;
    end
    %subplot(2,1,1);
    plot(t,dibit,'r');
    %grid on;
    hold on;
    %subplot(2,1,2);
    plot(t,z);
    hold on;
    grid on;
    axis([1 20 -3 3]);
    i=i+2;
end

Saturday, April 20, 2013

FM modulation


Ac=1;
fc=1;

Am=1;
fm=0.1;
kf=1.5;
B=kf*Am/fm;

t=[0:0.1:20];
ct=Ac*cos(2*pi*fc*t);
mt=Am*cos(2*pi*fm*t);
FMt=Ac*cos(2*pi*fc*t+B*sin(2*pi*fm*t));

subplot(2,2,1);
plot(mt);
ylabel('message signal');
grid on;

subplot(2,2,2);
plot(ct);
ylabel('carrier');
grid on;

subplot(2,2,3);
plot(FMt);
ylabel('FM signal');
grid on;

AM modulation


clc;
Ac=2;
fc=.9;

Am=.5;
fm=.05;
Fs=100;

ka=1;

t=[0:0.1:50];
ct=Ac*cos(2*pi*fc*t);
mt=Am*cos(2*pi*fm*t);
DSBAMt=ct.*(1+ka*mt);

subplot(2,2,1);
plot(mt);
ylabel('message signal');
grid on;

subplot(2,2,2);
plot(ct);
ylabel('carrier');
grid on;

subplot(2,2,3);
plot(DSBAMt);
ylabel('DSBAM signal');
grid on;

Saturday, January 26, 2013

matlab code for digital modulation(ask, fsk and psk)


%matlab code for digital modulation(ask, fsk and psk)
pi=3.14;
f=5;
f2=10;
phi=pi;

x=[1 0 1 1 0];
nx=size(x,2);

i=1;
while i<nx+1
     t = i:0.001:i+1;
    if x(i)==1
       ask=sin(2*pi*f*t);
       fsk=sin(2*pi*f*t);
       psk=sin(2*pi*f*t);
    else
        ask=0;
        fsk=sin(2*pi*f2*t);
        psk=sin(2*pi*f*t+phi);
    end
    subplot(3,1,1);
    plot(t,ask);
    hold on;
    grid on;
    axis([1 10 -2 2]);
 
    subplot(3,1,2);
    plot(t,fsk);
    hold on;
    grid on;
    axis([1 10 -2 2]);
 
    subplot(3,1,3);
    plot(t,psk);
    hold on;
    grid on;
    axis([1 10 -2 2]);
 
    i=i+1;
end